Stainless Insights in China from August 25th to August 31st.
WEEKLY AVERAGE PRICES
| Grade | Origin | Market | Average Price (US$/MT) | Price Difference (US$/MT) | Percentage (%) |
| 304/2B | ZPSS | Wuxi | 2,065 | -3 | -0.15% |
| Foshan | 2,105 | -3 | -0.14% | ||
| Hongwang | Wuxi | 1,965 | 1 | 0.08% | |
| Foshan | 1,975 | 9 | 0.46% | ||
| 304/NO.1 | ESS | Wuxi | 1,895 | 7 | 0.40% |
| Foshan | 1,915 | 7 | 0.40% | ||
| 316L/2B | TISCO | Wuxi | 3,790 | 28 | 0.78% |
| Foshan | 3,820 | 30 | 0.81% | ||
| 316L/NO.1 | ESS | Wuxi | 3,650 | 20 | 0.57% |
| Foshan | 3,655 | 34 | 0.98% | ||
| 201J1/2B | Hongwang | Wuxi | 1,250 | -1 | -0.12% |
| Foshan | 1,260 | 14 | 1.26% | ||
| J5/2B | Hongwang | Wuxi | 1,150 | 6 | 0.55% |
| Foshan | 1,160 | 14 | 1.38% | ||
| 430/2B | TISCO | Wuxi | 1,180 | 6 | 0.54% |
| Foshan | 1,170 | 18 | 1.78% |
TREND | Stainless Steel Transactions Improve as Peak Season Approaches
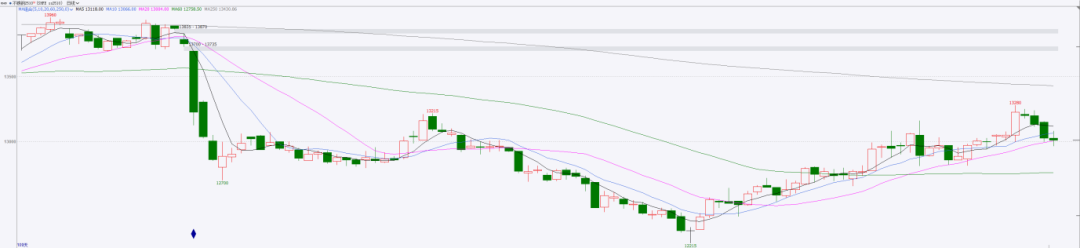
Last week, stainless steel futures in the Wuxi market fluctuated with a stronger bias. After consecutive early declines, the approach of September’s traditional consumption season boosted sentiment. Transactions improved, and inventory reduction accelerated. Rising raw material prices also pushed production costs higher.
•By Friday, the main stainless steel futures contract climbed $9.2/MT week-on-week to $1,930/MT (+0.51%).
300 Series: Costs Rising, Prices Stabilize
•304 market prices rose slightly.
•Cold-rolled four-foot coils in Wuxi: $1,965/MT (+$7).
•Hot-rolled prices: $1,895/MT (+$14).
•Mills’ raw material procurement prices rebounded, stabilizing spot prices.
•Indonesian Yongwang resumed production in late July; new arrivals at port supplemented cold-rolled supply.
200 Series: Mixed Spot Market Trends
•201J1 cold-rolled: +$7/MT.
•201J2 cold-rolled & 201J1 hot-rolled: +$14/MT.
•Early week futures lifted spot offers to $1,130/MT, boosting transactions.
•As futures reversed, spot offers fell back to $1,120/MT, weakening downstream activity.
400 Series: Raw Material Costs Add Pressure
•In Wuxi, 430 cold-rolled rose to $1,160/MT (+$7).
•430 hot-rolled remained stable at $1,055/MT.
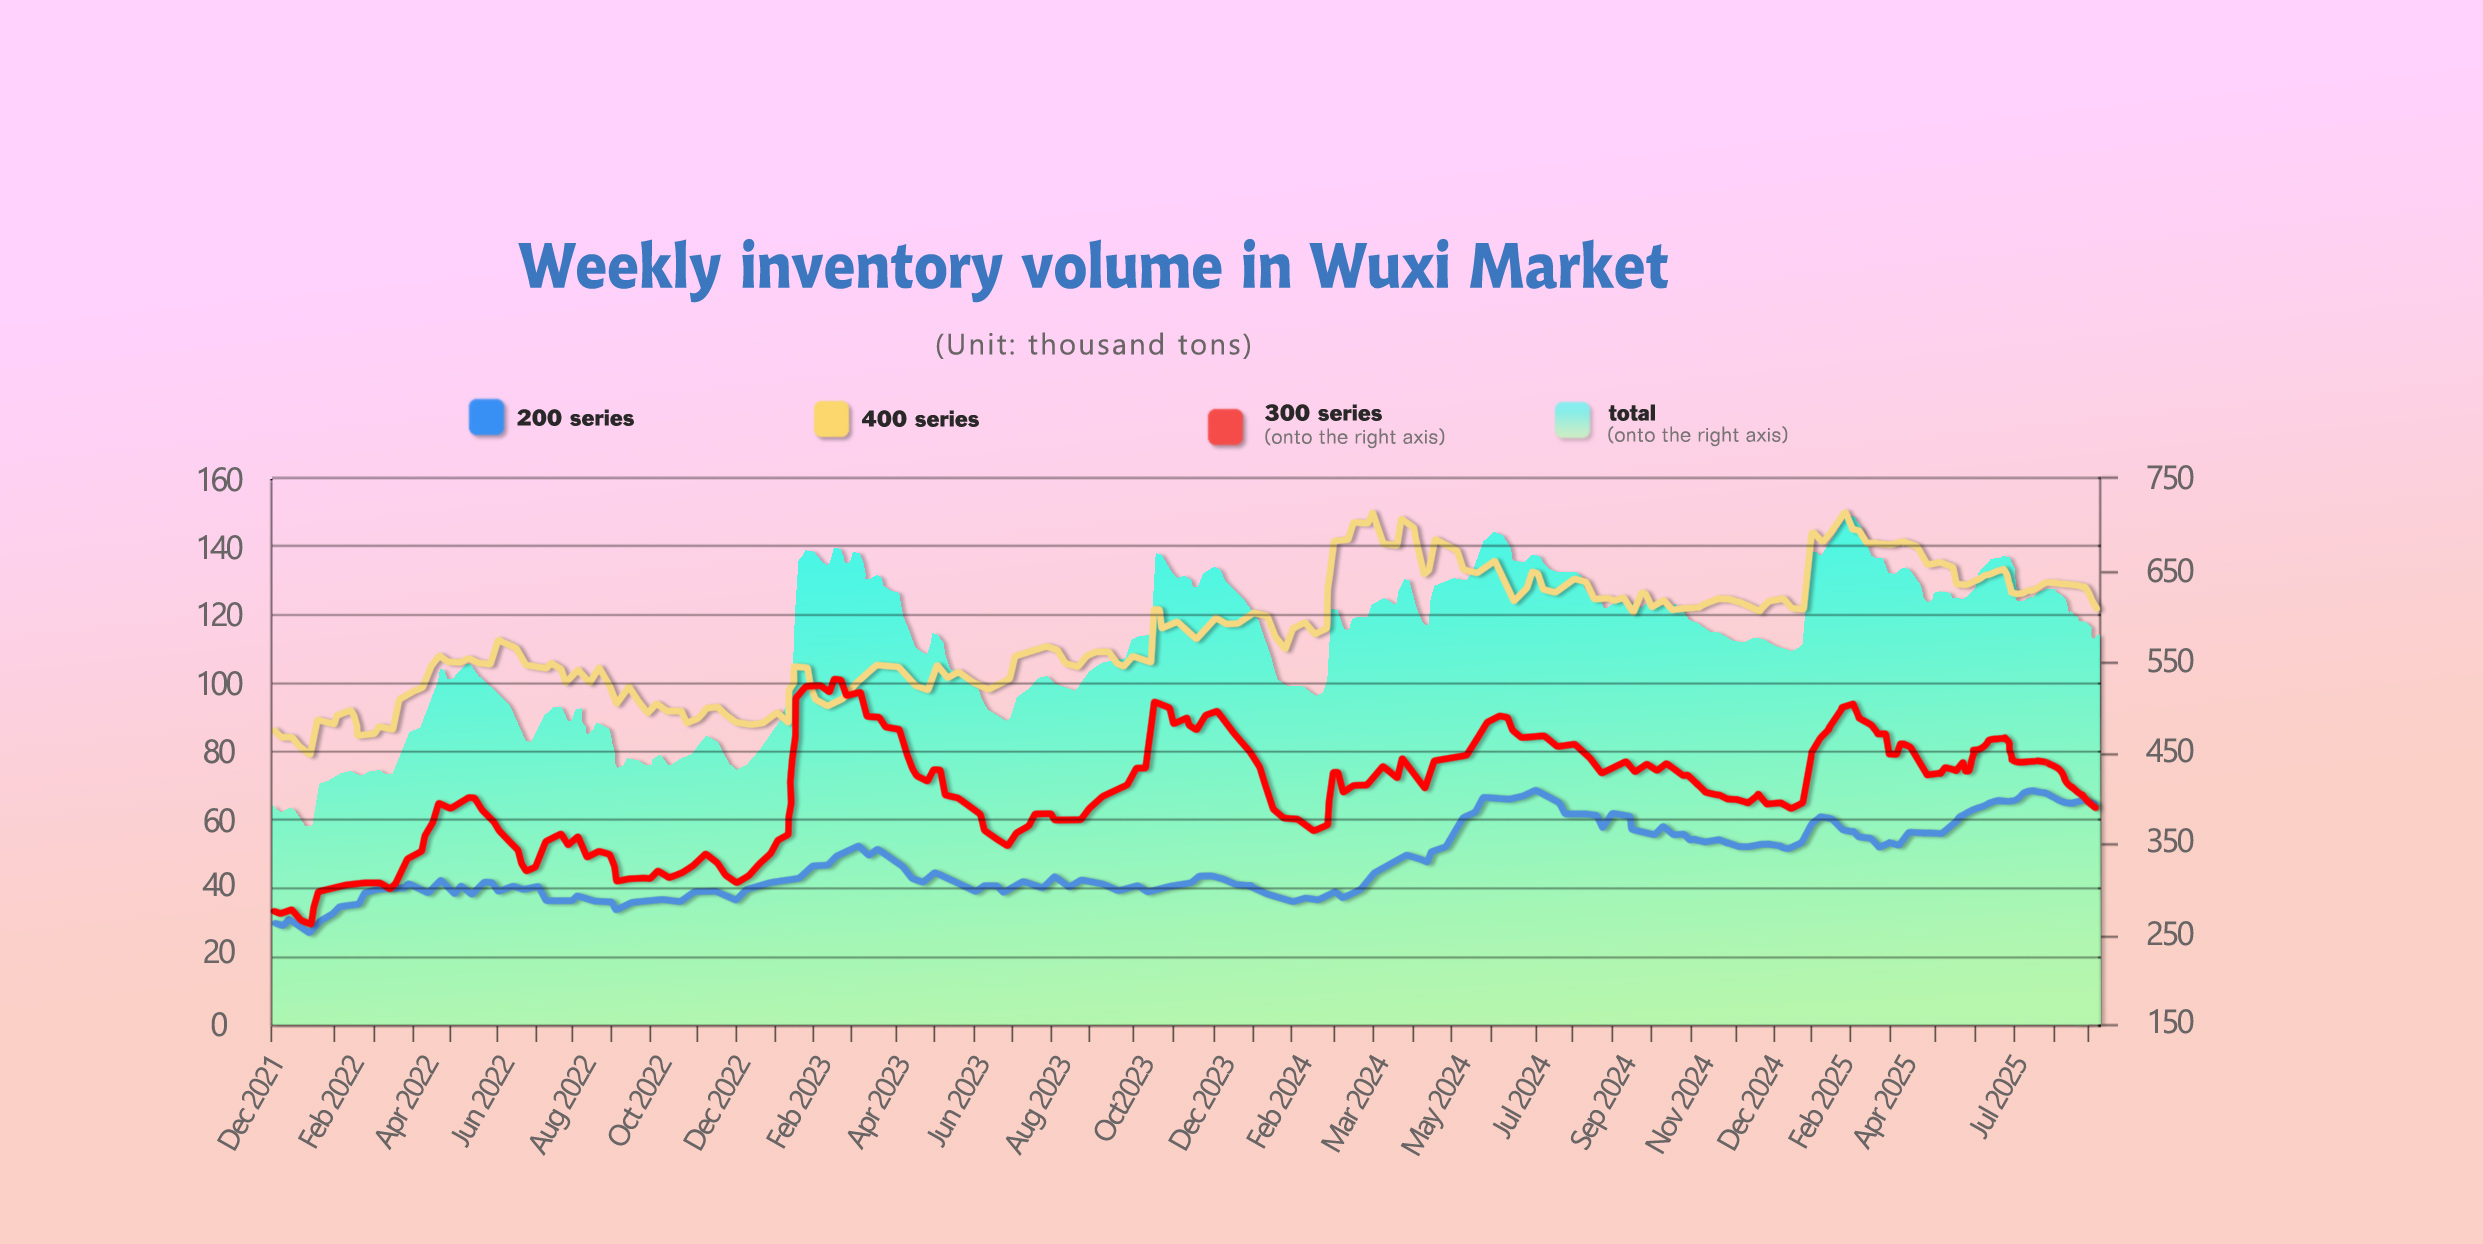
INVENTORY | Wuxi Stainless Steel Stocks Drop by 21,565 Tons
As of August 28, inventories at Wuxi sample warehouses fell to 565,820 tons, a weekly reduction of 21,565 tons.
Breakdown:
•200 Series: down 2,803 tons → 62,000 tons.
•300 Series: down 11,992 tons → 383,139 tons.
•400 Series: down 6,770 tons → 120,681 tons.
| Inventory in Wuxi sample warehouse (Unit: tons) | 200 series | 300 series | 400 series | Total |
| Aug 21st | 64,803 | 395,131 | 127,451 | 587,385 |
| Aug 21st | 62,000 | 383,139 | 120,681 | 565,820 |
| Difference | -2,803 | -11,991 | -6,770 | -21,565 |
300 Series: Faster Destocking Despite Late-Week Slowdown
•Early price rebound supported transactions.
•Some mill agents accelerated warehouse drawdowns.
•However, renewed price weakness slowed downstream buying later in the week.
•With September’s peak demand ahead, destocking is expected to continue.
200 Series: Bulk Deliveries Shift Inventory
•Hongwang cold-rolled stocks fell notably.
•Beigang hot-rolled arrivals lifted inventories slightly.
•Both cold-rolled and hot-rolled 201 prices rose $14/MT, but downstream buyers showed limited acceptance of higher hot-rolled prices.
400 Series: Demand-Driven Destocking
•JISCO cold-rolled stocks decreased significantly.
•TISCO cold-rolled and hot-rolled also fell slightly.
•Declines were supported by limited mill arrivals and steady spot transactions.
GLOBAL OUTPUT | Stainless Steel Production Up 5% in Q2
From April to June 2025 (Q2), global stainless steel output rose 5% from the previous quarter to 16.36 million tons, up 3.1% year-on-year.
During the same period, European stainless steel production fell 5.1% year-on-year and 4.1% quarter-on-quarter to 1.54 million tons. U.S. production rose 7.8% year-on-year and 1.1% quarter-on-quarter to 559,000 tons.
In Asia (excluding China and South Korea), Q2 production grew 4.1% year-on-year but fell 2.2% quarter-on-quarter to 3.49 million tons. China’s output reached 10.54 million tons, up 3.9% year-on-year and 9.6% quarter-on-quarter.
Other countries including Ukraine, Brazil, South Africa, Indonesia, South Korea, and Russia produced 225,000 tons, up 2.9% year-on-year and 1% quarter-on-quarter.
As reported earlier by GMK Center, global stainless steel output in 2024 rose 7% year-on-year to 62.62 million tons. Within that, European production (including Ukraine) rose 1.5% to 6.09 million tons, U.S. production increased 6.9% to 1.95 million tons, China’s production reached 39.44 million tons (up 7.5%), and Asian output excluding China and South Korea grew 6.4% to 7.32 million tons.
RAW MATERIAL | Nickel Supply Concerns Drive Volatility
Political unrest in Indonesia, the world’s largest NPI producer, raised concerns about supply security.
•On September 1, SHFE nickel futures surged to $17,320/MT (+1.77%).
•LME nickel rose 2.8% WoW, closing at $15,380/MT, marking a short-term high.
•SHFE contracts (ni2509 & ni2510) also rose 1.8%.
🔎 Impact: Market panic over Indonesian disruptions boosted nickel prices across both Asian and global exchanges, adding upward cost pressure on 300-series stainless steel.
SUMMARY | Costs Limit Downside, Seasonal Demand Offers Support
•Stainless steel spot prices dipped slightly, but raw material costs stayed firm.
•Mills are resuming post-maintenance production, which may increase supply pressure.
•Demand remained driven by rigid procurement; inventories showed slight recovery.
Outlook by Series:
•300 Series: Rising costs restrict downside; peak-season demand expected to support mild gains.
•200 Series: Prices likely stable; sentiment supported by September outlook.
•400 Series: Higher ferrochrome costs and falling inventories underpin stronger price expectations.
MACRO | Global Stainless Steel Prices Shift Higher
Recently, global stainless steel offers have moved upward. European stainless steel producers and their U.S. subsidiaries have raised alloy surcharges for September, while Taiwan and other Asian markets also reported further price hikes. Since early August, Asian molybdenum prices have surged, with ferro-molybdenum up more than 7.5%, exerting a significant impact on grades such as 316 and 316L.
1. Europe Leads the Uptrend
The European stainless steel market was the first to announce higher prices. Finnish producer Outokumpu raised alloy surcharges for flat products in September—the first increase since May.
·The surcharge for 304 stainless steel rose to €2,192 per ton, up €48 from August.
·The surcharge for 316L jumped to €3,725 per ton, up €112.
·The surcharge for 430 stainless steel increased to €1,149 per ton, up €10.
Soon after, Luxembourg-based Aperam also raised alloy surcharges for austenitic flat products in September.
·The surcharge for 304 stainless rose from €1,835 to €1,875 per ton.
·The surcharge for 316L increased from €3,113 to €3,213 per ton.
This marked a turning point, ending four consecutive months of declines in the European stainless steel market.
2. Asian Mills Follow the Trend
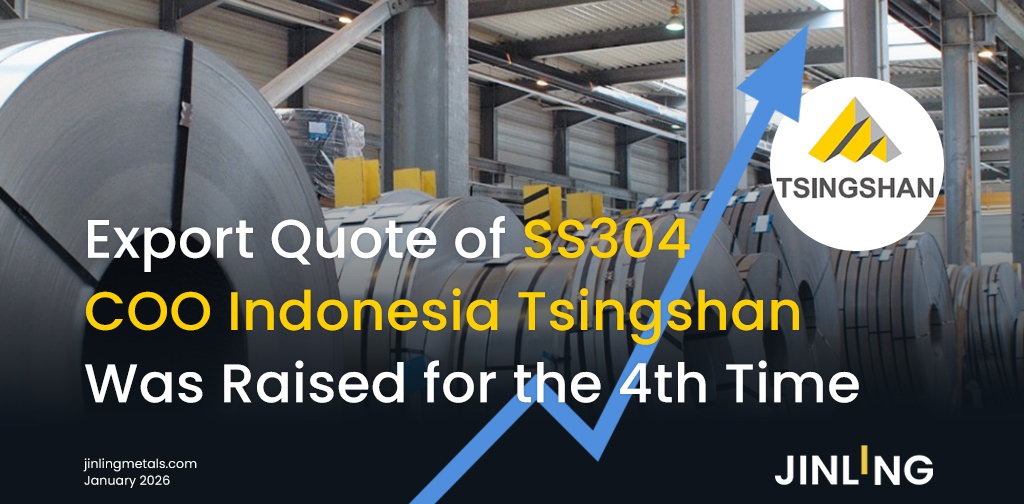
In Asia, mainland Chinese mills had already lifted list prices in late June, with Indonesia’s Tsingshan continuing to raise export offers since July. Taiwan’s major stainless producers quickly followed.
·On August 28, Yieh United Steel and Walsin Lihwa announced broad price hikes for September. Yieh raised 304 stainless steel by US$132/MT, 430 by US$16.5/MT, and 316L surcharges by US$99.2/MT.
·Walsin lifted 300-series, 316-series, and 200-series prices by US$33-US$132.3/MT, marking the fourth consecutive monthly increase for the 300 series.
·Tang Eng went further, announcing on August 29 that September 304 prices would rise by US$165-US4198/MT, while 316L surcharges increased by US$99.3/MT.
3. Drivers of the Uptrend
The core driver behind the global rally is surging raw material costs. Nickel and chromium, both critical inputs in stainless steel production, have risen sharply, pushing mills to pass on costs through higher offers.
The cost burden is most severe for molybdenum-bearing grades such as 316L, explaining their much larger price adjustments.
However, the contrast between cost-driven increases and still-weak end-user demand raises doubts about the sustainability of this rally. With the traditional “Golden September, Silver October” consumption season approaching, stainless steel may enter another upward cycle—but both the scale and duration of the rally will ultimately depend on demand absorption.
China Manufacturing PMI up 0.1 from July but still in contraction territory
China’s manufacturing PMI for August came in at 49.4%, up 0.1 from July but still in contraction territory. The new orders index rose slightly to 49.5%, showing modest improvement. The non-manufacturing business activity index climbed 0.2 points to 50.3, remaining in expansion. New export orders edged up to 47.2%, signaling a stabilization in external demand.
The production index rose to 50.8%, up 0.3 points. Large enterprises reported stronger performance, with a PMI of 50.8, a 0.5-point increase, and new orders rising by 1.2 points to nearly 52%, reflecting faster expansion on both supply and demand sides. Small enterprises also showed signs of recovery, with the PMI rising 0.2 points to 46.6.
Meanwhile, the raw material purchasing price index jumped to 53.3%, up 1.8 points and in expansion for the second consecutive month, underscoring the accelerating rise in input costs.
SEA FREIGHT | Rates Hold Steady with Regional Variations
On August 29, the Shanghai Containerized Freight Index (SCFI) rose 2.1% to 1445.06 points.
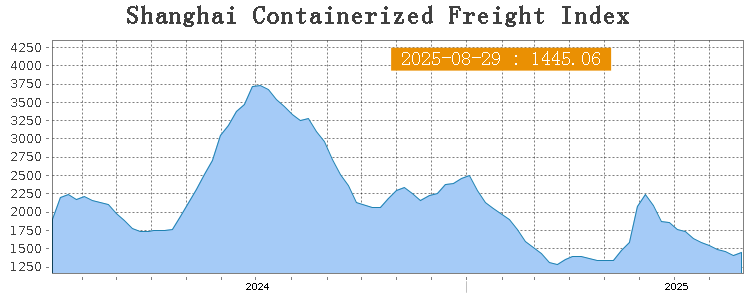
•Europe: $1,481/TEU (–11.2%).
•Mediterranean: $2,145/TEU (–3.6%).
•U.S. West Coast: $1,923/FEU (+17%).
•U.S. East Coast: $2,866/FEU (+9.7%).
•Persian Gulf: $1,579/TEU (+6.8%).
•Australia & New Zealand: $1,325/TEU (+4.6%).
•South America: $3,027/TEU (–2.6%).
Takeaway: The stainless steel market is entering September with firmer cost support, tightening inventories, and cautiously improving demand. Raw material volatility—particularly nickel—remains the key driver of near-term pricing.